Makes plots for every region while summarizing the annotation
Source:R/plotRegionCoverage.R
plotRegionCoverage.RdThis function takes the regions found in calculatePvalues and assigns them genomic states contructed with makeGenomicState. The main workhorse functions are countOverlaps and findOverlaps. For an alternative plot check plotCluster which is much slower and we recommend it's use only after quickly checking the results with this function.
plotRegionCoverage(
  regions,
  regionCoverage,
  groupInfo,
  nearestAnnotation,
  annotatedRegions,
  txdb = NULL,
  whichRegions = seq_len(min(100, length(regions))),
  colors = NULL,
  scalefac = 32,
  ask = interactive(),
  ylab = "Coverage",
  verbose = TRUE
)
Arguments
- regions
The
$regionsoutput from calculatePvalues.- regionCoverage
The output from getRegionCoverage used on
regions.- groupInfo
A factor specifying the group membership of each sample. It will be used to color the samples by group.
- nearestAnnotation
The output from matchGenes used on
regions.- annotatedRegions
The output from annotateRegions used on
regions.- txdb
A TxDb object. If specified, transcript annotation will be extracted from this object and used to plot the transcripts.
- whichRegions
An integer vector with the index of the regions to plot.
- colors
If
NULLthen brewer.pal with the'Dark2'color scheme is used.- scalefac
The parameter used in preprocessCoverage.
- ask
If
TRUEthen the user is prompted before each plot is made.- ylab
The name of the of the Y axis.
- verbose
If
TRUEbasic status updates will be printed along the way.
Value
A plot for every region showing the coverage of each sample at each base of the region as well as the summarized annotation information.
Examples
## Load data
library("derfinder")
## Annotate regions, first two regions only
regions <- genomeRegions$regions[1:2]
annotatedRegions <- annotateRegions(
regions = regions,
genomicState = genomicState$fullGenome, minoverlap = 1
)
#> 2026-03-31 17:51:02.735218 annotateRegions: counting
#> 2026-03-31 17:51:02.791204 annotateRegions: annotating
## Find nearest annotation with bumphunter::matchGenes()
library("bumphunter")
library("TxDb.Hsapiens.UCSC.hg19.knownGene")
genes <- annotateTranscripts(txdb = TxDb.Hsapiens.UCSC.hg19.knownGene)
#> No annotationPackage supplied. Trying org.Hs.eg.db.
#> Getting TSS and TSE.
#> Getting CSS and CSE.
#> Warning: some group names are NAs or duplicated
#> Getting exons.
#> Warning: some group names are NAs or duplicated
#> Annotating genes.
nearestAnnotation <- matchGenes(x = regions, subject = genes)
## Obtain fullCov object
fullCov <- list("21" = genomeDataRaw$coverage)
## Assign chr lengths using hg19 information
library("GenomeInfoDb")
seqlengths(regions) <- seqlengths(getChromInfoFromUCSC("hg19",
as.Seqinfo = TRUE
))[
mapSeqlevels(names(seqlengths(regions)), "UCSC")
]
## Get the region coverage
regionCov <- getRegionCoverage(fullCov = fullCov, regions = regions)
#> extendedMapSeqlevels: sequence names mapped from NCBI to UCSC for species homo_sapiens
#> 2026-03-31 17:51:34.41187 getRegionCoverage: processing chr21
#> 2026-03-31 17:51:34.440634 getRegionCoverage: done processing chr21
#
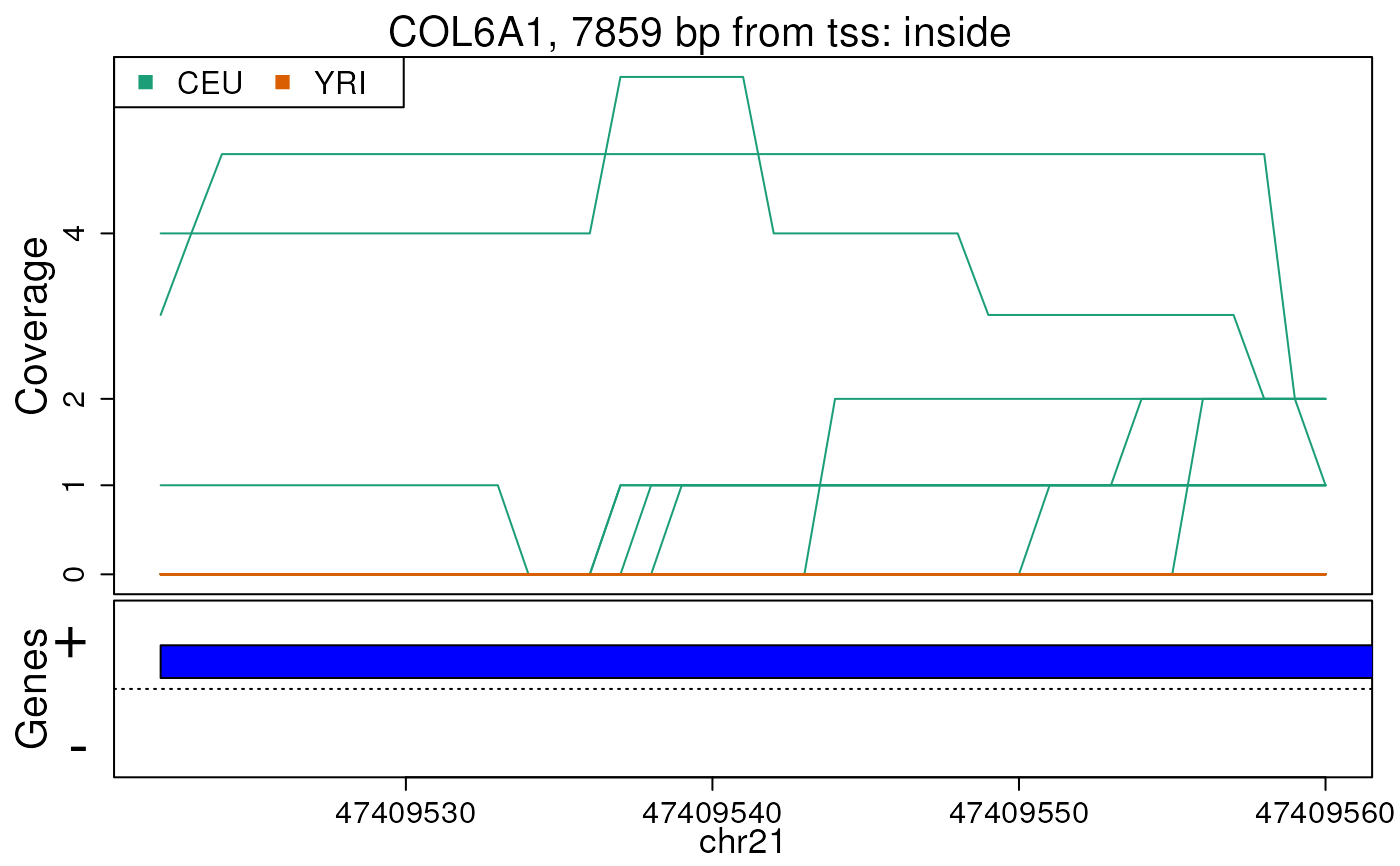
## Make plots for the regions
plotRegionCoverage(
regions = regions, regionCoverage = regionCov,
groupInfo = genomeInfo$pop, nearestAnnotation = nearestAnnotation,
annotatedRegions = annotatedRegions, whichRegions = 1:2
)

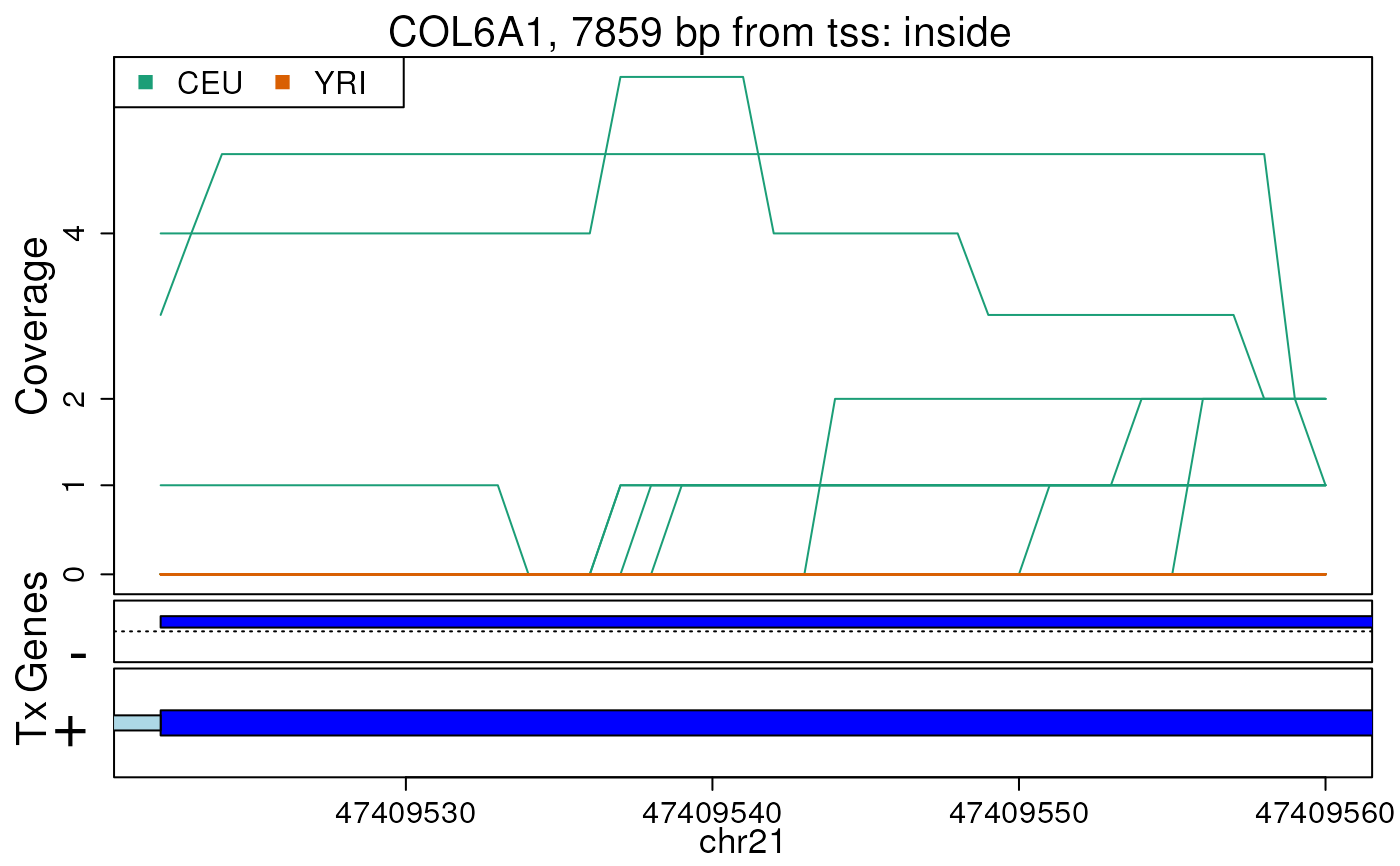
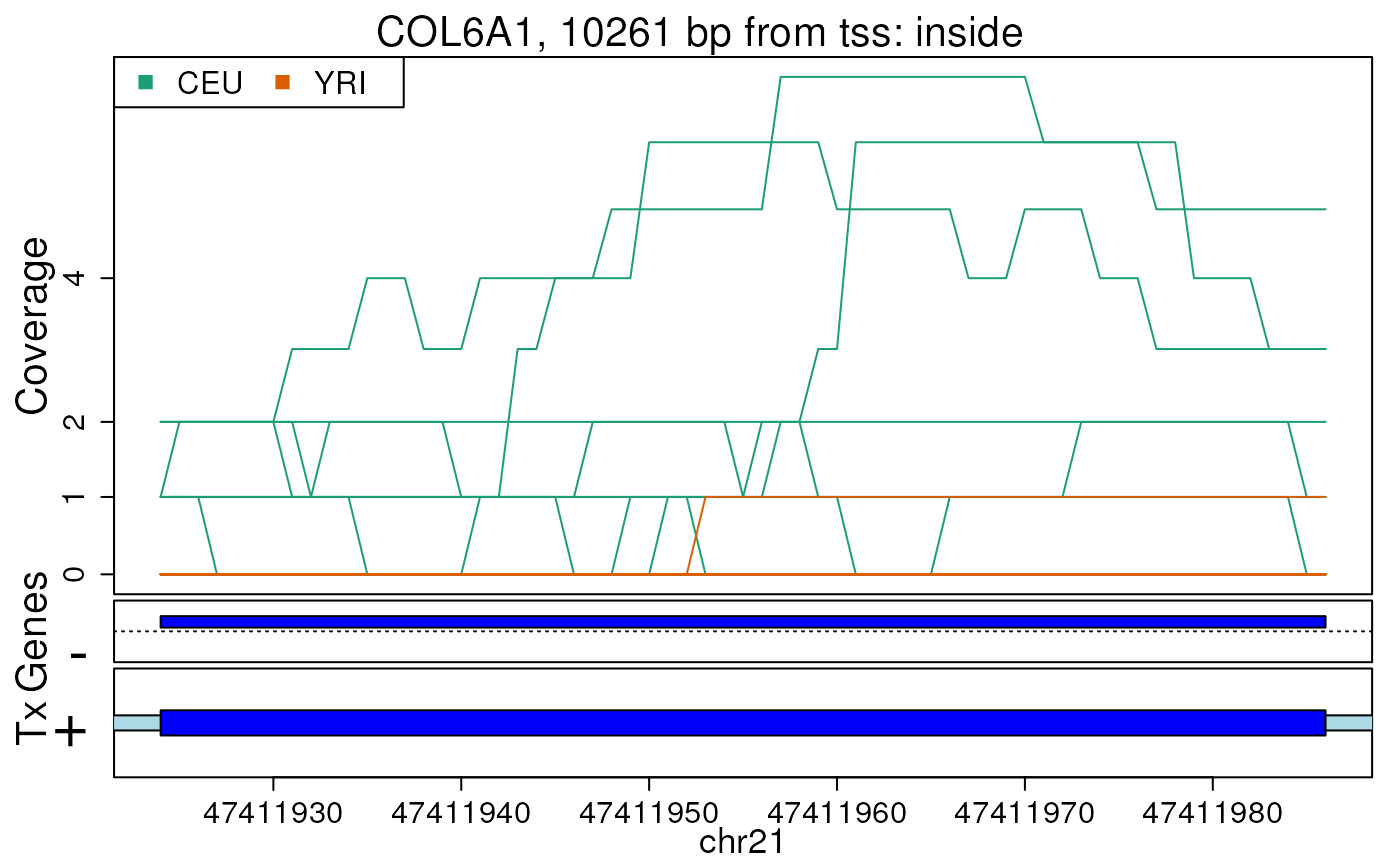
 ## Re-make plots with transcript information
plotRegionCoverage(
regions = regions, regionCoverage = regionCov,
groupInfo = genomeInfo$pop, nearestAnnotation = nearestAnnotation,
annotatedRegions = annotatedRegions, whichRegions = 1:2,
txdb = TxDb.Hsapiens.UCSC.hg19.knownGene
)
#> 2026-03-31 17:51:34.597573 plotRegionCoverage: extracting Tx info
#> 2026-03-31 17:51:39.650019 plotRegionCoverage: getting Tx plot info
## Re-make plots with transcript information
plotRegionCoverage(
regions = regions, regionCoverage = regionCov,
groupInfo = genomeInfo$pop, nearestAnnotation = nearestAnnotation,
annotatedRegions = annotatedRegions, whichRegions = 1:2,
txdb = TxDb.Hsapiens.UCSC.hg19.knownGene
)
#> 2026-03-31 17:51:34.597573 plotRegionCoverage: extracting Tx info
#> 2026-03-31 17:51:39.650019 plotRegionCoverage: getting Tx plot info

 if (FALSE) { # \dontrun{
## If you prefer, you can save the plots to a pdf file
pdf("ders.pdf", h = 6, w = 9)
plotRegionCoverage(
regions = regions, regionCoverage = regionCov,
groupInfo = genomeInfo$pop, nearestAnnotation = nearestAnnotation,
annotatedRegions = annotatedRegions, whichRegions = 1:2,
txdb = TxDb.Hsapiens.UCSC.hg19.knownGene, ask = FALSE
)
dev.off()
} # }
if (FALSE) { # \dontrun{
## If you prefer, you can save the plots to a pdf file
pdf("ders.pdf", h = 6, w = 9)
plotRegionCoverage(
regions = regions, regionCoverage = regionCov,
groupInfo = genomeInfo$pop, nearestAnnotation = nearestAnnotation,
annotatedRegions = annotatedRegions, whichRegions = 1:2,
txdb = TxDb.Hsapiens.UCSC.hg19.knownGene, ask = FALSE
)
dev.off()
} # }